Sales
BI
Field data transformed into strategic vision for the commercial operation.
A Business Intelligence platform developed to centralize commercial actions, visits, institutions, leads and performance indicators, transforming operational data into clear information for monitoring and decision making.
HOW IT WORKS- CATEGORY
- Business Intelligence · Sales Management · Data
- ENVIRONMENT
- Web Dashboard · Sales Operation
- DATA SOURCE
- Field Actions · Visits · Leads · Institutions
- FLOW
- Record · Centralization · Analysis · Indicators
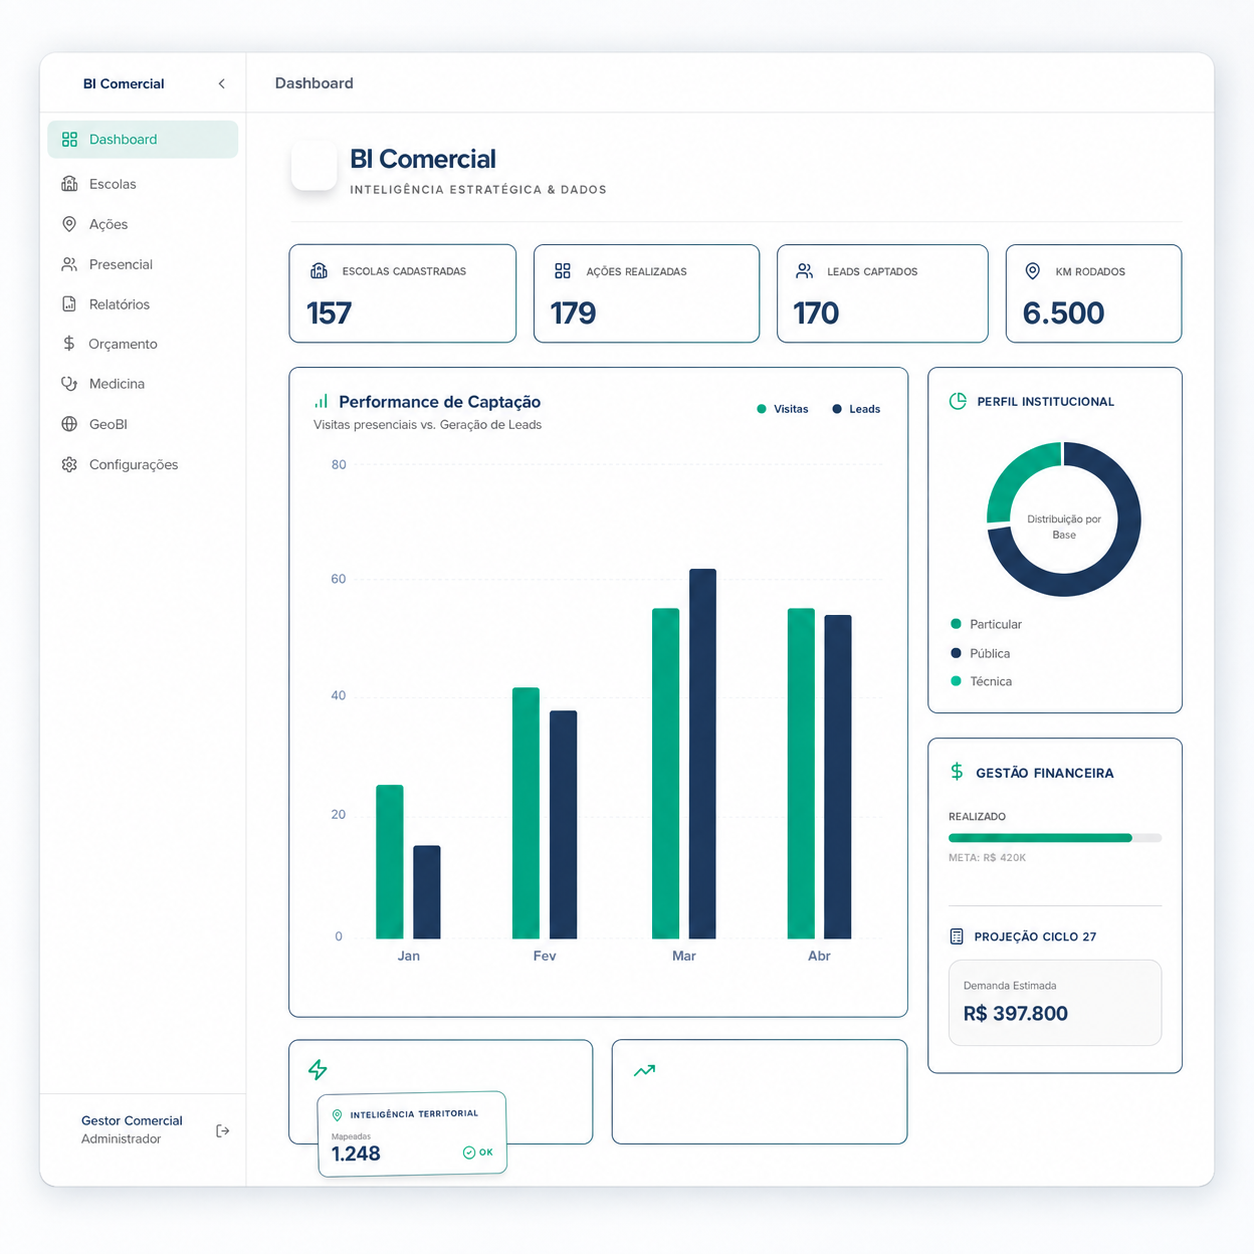
The project presented was configured for a commercial operation in the educational segment, a context that explains the presence of educational institutions, visits, and field actions in the demonstrations. Its structure, however, is adaptable to different businesses, allowing for the customization of records, products or services, teams, territories, indicators, goals, and flows according to each commercial operation.
How it works in practice
Sales BI centralizes information that is usually scattered between spreadsheets, individual records and different points of the operation. Data is organized in a single interface to allow performance monitoring, period comparison and quick identification of key commercial indicators.
“Total visibility over commercial effort and results.”
01 — CENTRALIZED COMMERCIAL OPERATION
Sales BI gathers in a single environment information that is normally distributed between spreadsheets, teams and different points of the operation.
With access defined by profile, areas such as internal sales, field sales and management can work on the same information base, keeping records, activities and indicators connected. The administrator preserves a broad view of the operation, while each team accesses and updates the information related to their responsibilities.
“A single base for different fronts of the commercial operation.”
02 — TERRITORIAL INTELLIGENCE AND FIELD PLANNING
Institutions and points of interest can be registered with strategic information, location, relationship history and relevant data for commercial action.
Geographic visualization facilitates understanding the territorial distribution of the operation and supports the planning of visits and face-to-face actions. With this information centralized, the team can better organize travel, identify nearby institutions and plan more efficient routes for different regions.
“Commercial data also guides where the team should be.”
03 — EXECUTION AND HISTORY OF COMMERCIAL ACTIONS
Each visit, event or commercial action can be recorded with the person responsible, institution, location, date, result and relevant activity information.
These records build a history of commercial action, allowing monitoring of what has already been done, which institutions received visits, which actions generated opportunities and which regions still need attention. Leads captured and results of each initiative are no longer isolated and become part of the general view of the operation.
“Each field action now generates information for the next decision.”
04 — BUDGET AND OPERATIONAL PREDICTABILITY
Commercial planning can be connected to the budget available for each period, allowing monitoring of what was planned, what has already been used and how resources are being distributed throughout the operation.
Expenses related to visits, travel, fuel, events and field actions can be recorded and linked to the commercial activities themselves. With the consolidated history, management also gains a clearer base to project future periods, estimate investment needs and build forecasts for the next operation cycles.
“History to understand the present. Data to plan the next cycle.”
05 — STRATEGIC VISION AND FUTURE PLANNING
The BI consolidates financial, operational and territorial information to offer a broader reading of the commercial performance.
Management can identify which institutions have already been visited, which regions received greater attention, which cities still have opportunities for action and how resources were used in each period. Geographic visualization allows seeing on the map the existing commercial coverage and the territories not yet worked, supporting the planning of new routes, visits and priorities. Similarly, the history of expenses, actions and results creates a base for future projections, allowing estimating spending, organizing new commercial cycles and planning the operation with greater predictability. Thus, BI doesn't just show what happened. It helps understand what has already been done, identify what is still missing and plan what should happen next.
“From history to forecast. From the territory already served to the next opportunities.”
What Sales BI delivers
Centralized operation view
Gathers the main commercial indicators in a single interface.
Goal tracking
Allows visualizing evolution and performance in relation to defined objectives.
Field action analysis
Organizes visits, events, institutions and other activities performed by the team.
Commercial indicators
Transforms operational records into clear metrics for management monitoring.
Geographic view
Facilitates the analysis of the territorial distribution of actions and commercial opportunities.
Data-based decisions
Reduces dependence on scattered information and offers a structured base for strategic decisions.
COMMERCIAL INTELLIGENCE
From field operation to strategic vision.
The value of BI is not just in displaying numbers, but in transforming operational information into a clear reading of the business. By centralizing data and indicators, management can better understand what is happening, where the opportunities are and which actions need attention.
The project was structured to make commercial data more accessible, comparable and useful for decision making.
Data handled with focus on governance and strategic clarity.
BI Comercial
Transforming the commercial operation through data intelligence.